PRODUCT PAGE

NetMapper network analyzer for IEC-104, Modbus & OPC-UA SCADA traffic

Full, real-time visibility into what's actually happening on your control system communication links — without installing agents on your RTUs or making any changes to your network.

CAPABILITIES

Protocol analysis built for operational technology networks.

Live Protocol Analysis

Passive sniffer or transparent proxy mode decodes traffic in real time across all three protocols — with no impact on network timing or RTU operation.

  • All 58 IEC-104 type IDs decoded (measurements, commands, setpoints, file transfers)
  • Modbus TCP function codes FC01–FC06, FC15–FC16
  • OPC-UA session and subscription monitoring

AI Anomaly Detection

An LSTM neural network detects unusual traffic sequences in real time. Ensemble scoring combines multiple detectors to reduce false positives and surface only actionable alerts.

  • LSTM sequence model trained on your own traffic
  • Isolation Forest and Autoencoder ensemble
  • Severity-ranked alerts with per-detector breakdown

Rule-Based IDS

Out-of-the-box detection of known attack patterns and protocol violations — no tuning required before first use.

  • Command floods and interrogation storms
  • Replay pattern detection
  • IEC-104 and Modbus spec violation alerts

IOA Map

Complete map of every Information Object Address on every RTU. Instantly spot unexpected datapoints, unauthorized writes, or new addresses that were never commissioned.

  • Read, write, and accumulation counters per IOA
  • Last known value and last-seen timestamp
  • Filter by type, address range, or RTU

Sequence of Events

Every measurement value and control command logged with millisecond timestamps, ready for incident documentation and regulatory reporting.

  • Filter by ASDU type (M_ME_NB, C_IC_NA, M_SP_NA…)
  • Export SOE to PDF for reports
  • Cause-of-transmission breakdown per event

Network Topology

Auto-discovers RTUs, MTUs, and HMIs and builds a live network map with per-node event logs and traffic statistics.

  • Node type classification (PLC, HMI, MTU)
  • TX/RX byte counters and request flow timeline
  • Export to GraphML for yEd or graph tooling

DEPLOYMENT MODEL

Delivered as a self-contained analysis node.

Passive Capture Mode

Runs on a standard Windows host with Npcap for packet capture. No taps, no spans required for basic deployments — plug into the existing switch mirror port and start capturing immediately.

Replay & Forensics

Replay captured CSV sessions offline, retrain ML detectors on historical traffic, and compare normal versus anomalous baselines for post-incident investigation.

Plugin Architecture

Extend NetMapper with custom protocol decoders without modifying the core engine. Detectors and analyzers are independently loadable modules.

Retrain on Your Traffic

The LSTM and ensemble detectors ship with generic baselines but are designed to be retrained on site-specific traffic for the lowest false-positive rate possible.

PRODUCT VISUALS

NetMapper interface in operation.

NetMapper IEC-104 protocol diagram showing ASDU type distribution, IOA map, and event sequence
IEC-104 Protocol Diagram — ASDU type distribution, cause-of-transmission breakdown, IOA map with read/write counters, and live sequence-of-events log.
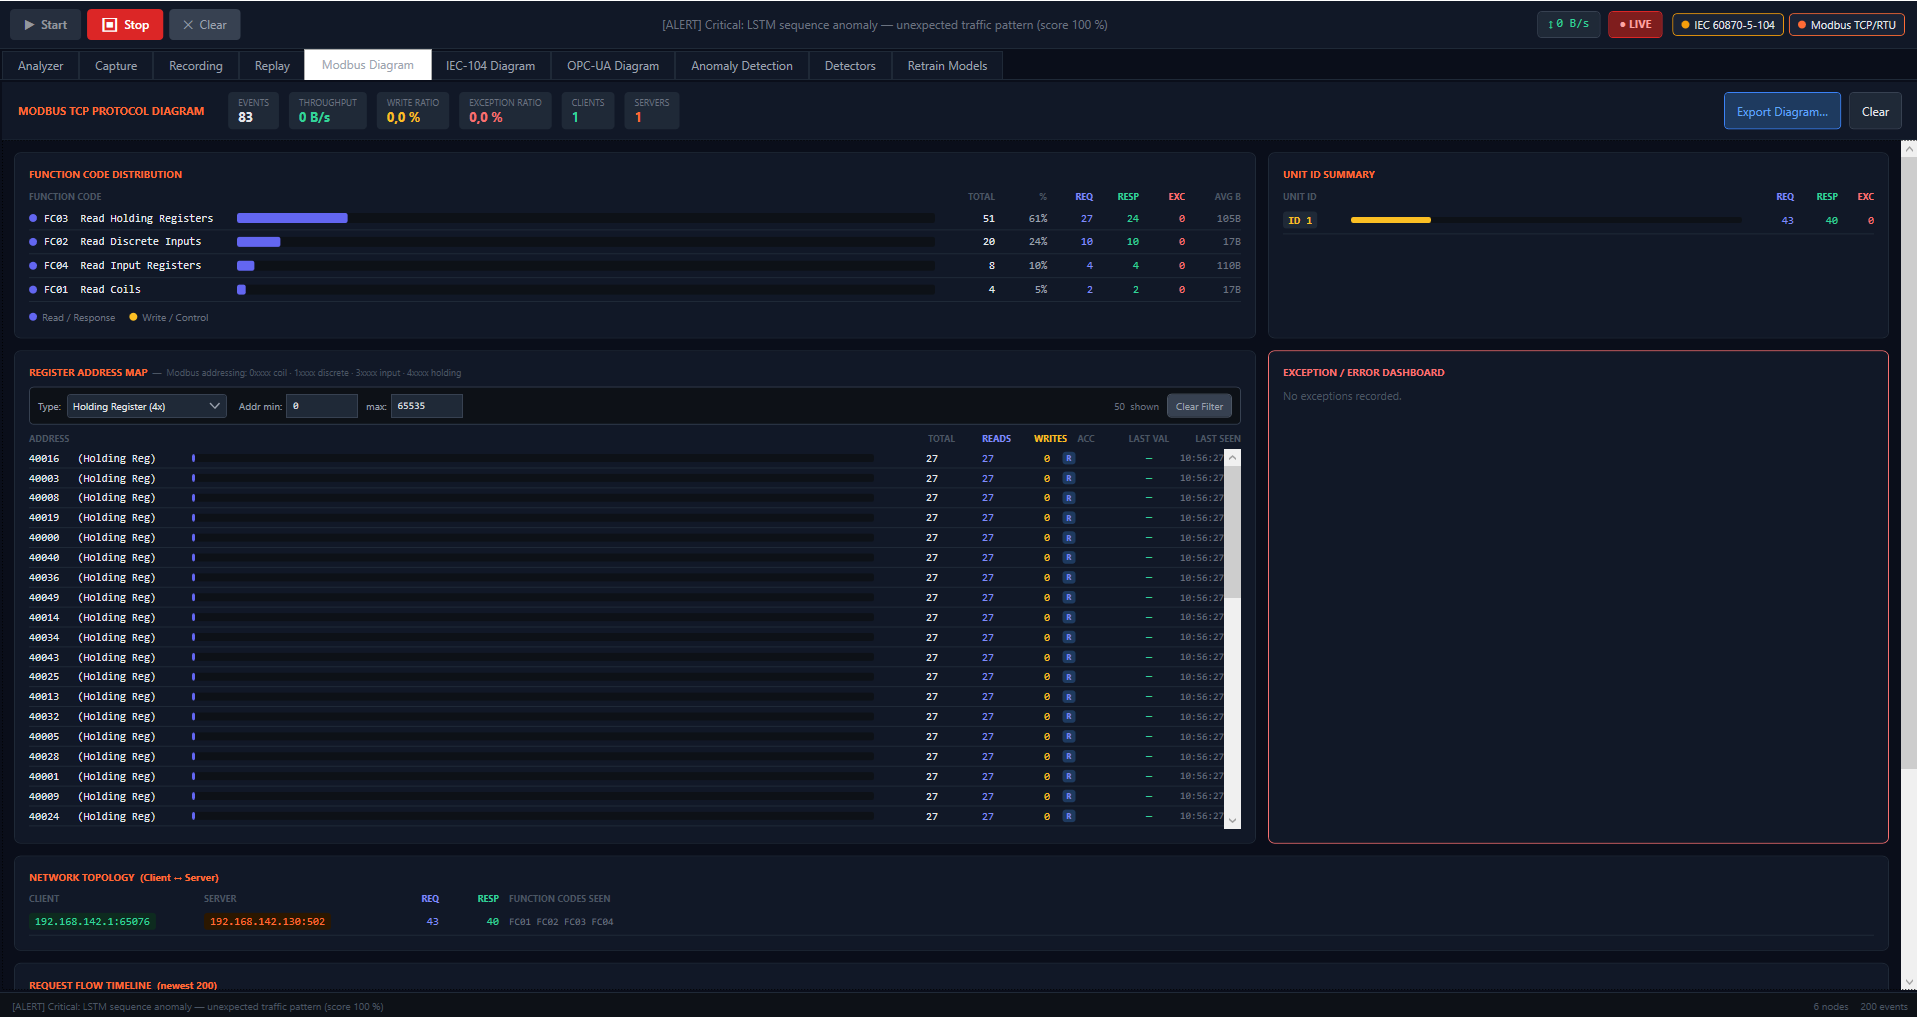
NetMapper Modbus TCP protocol diagram with function code distribution and register address map
Modbus TCP Protocol Diagram — function code distribution, register address map, unit ID summary, exception dashboard, and network topology.
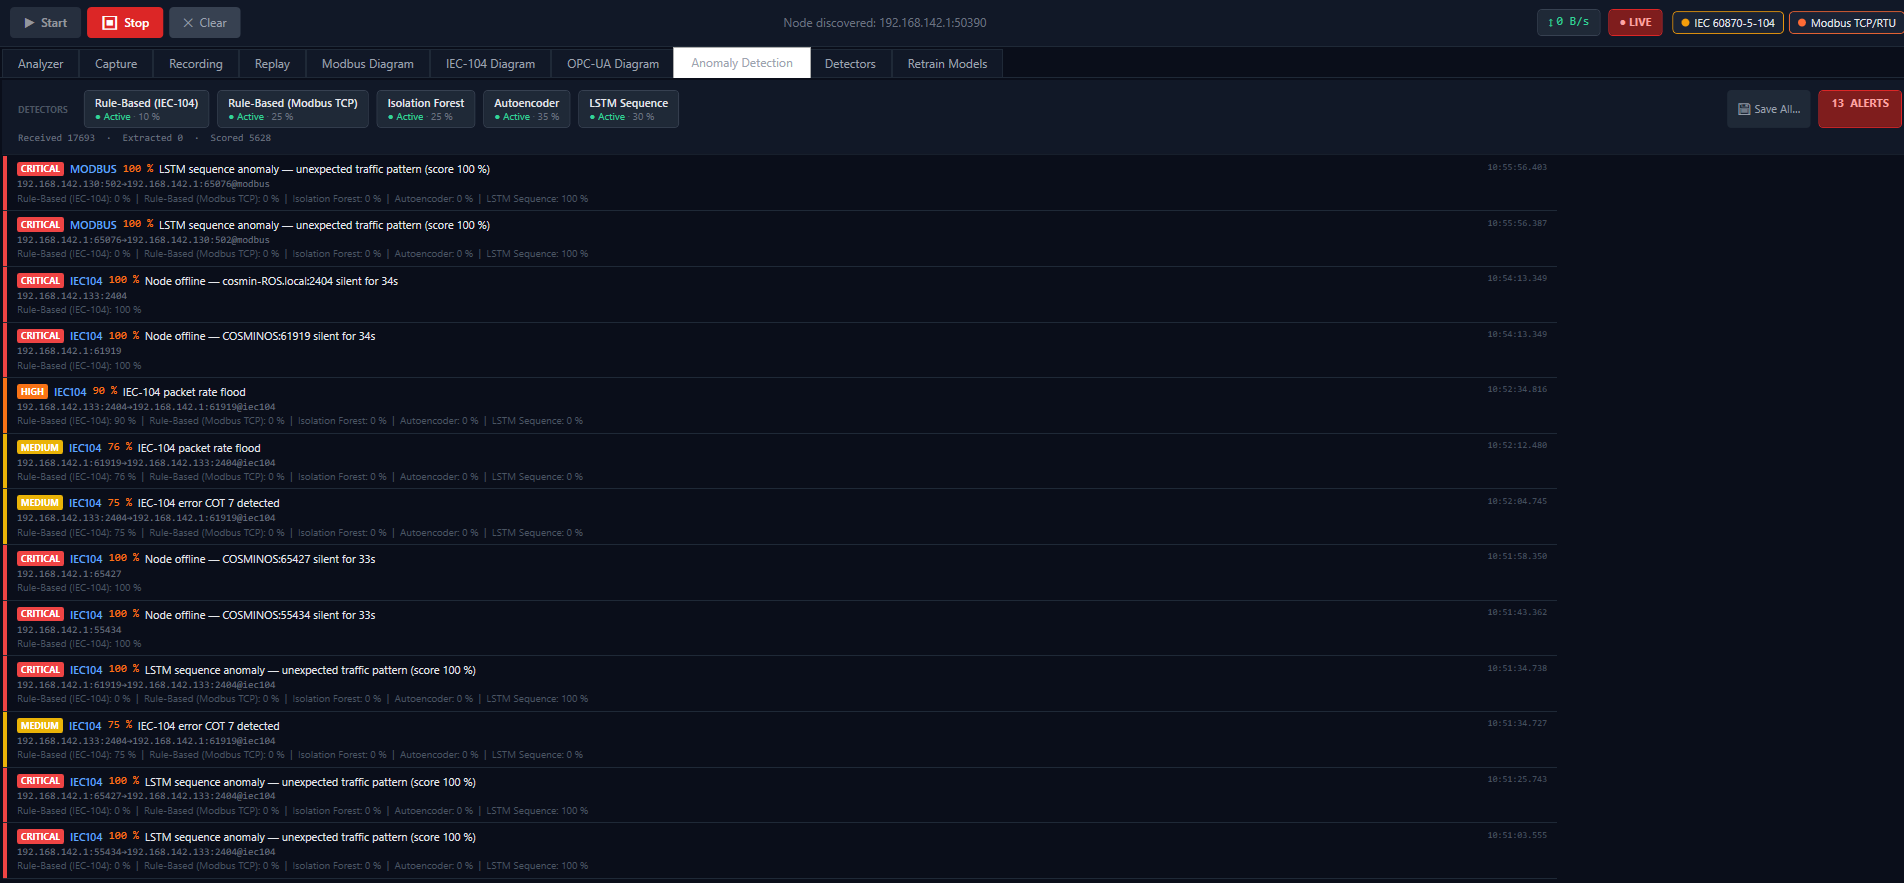
NetMapper anomaly detection panel showing LSTM, Isolation Forest, and rule-based IDS alerts
Anomaly Detection — ensemble scoring across Rule-Based IDS, Isolation Forest, Autoencoder, and LSTM Sequence detectors with severity-ranked alert feed.
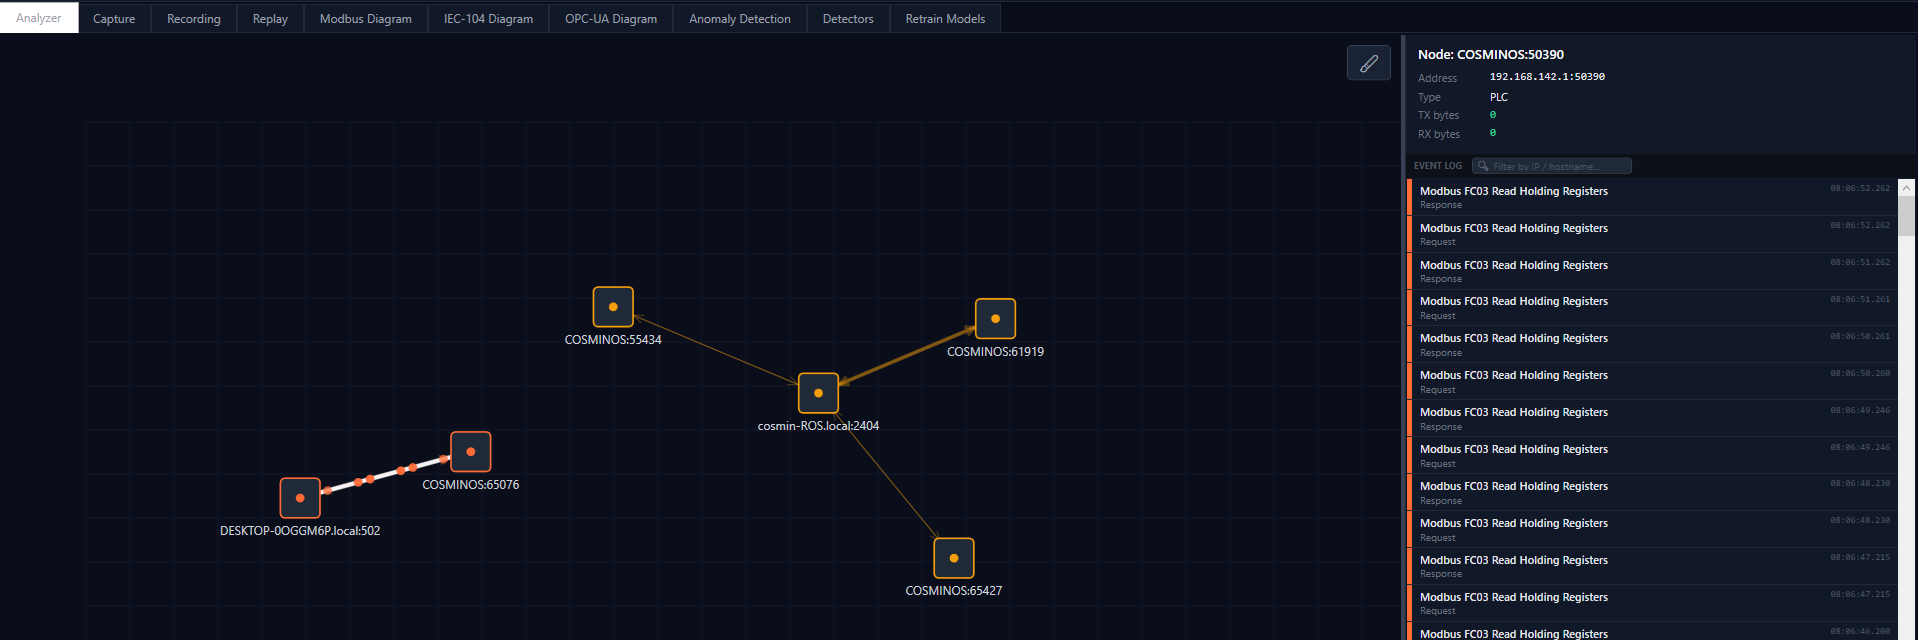
NetMapper live network topology graph with node event log
Live Network Topology — auto-discovered nodes (PLCs, MTUs, HMIs) with per-node event log and Modbus request flow.

RESOURCES

Typical integration scope and technical checkpoints.

Supported Protocols

IEC 60870-5-104 (all 58 type IDs), Modbus TCP/RTU, and OPC-UA — covering the protocols used in the vast majority of SCADA and substation automation networks.

Host Requirements

Windows 10/11 with Npcap for passive capture. Mirror port or TAP access to the OT network segment. No agents, no changes to RTU firmware or PLC configuration.

Project Outputs

IOA dictionary, node inventory, baseline anomaly model, alert threshold documentation, and SOE export templates for your reporting workflow.

CONTACT

Need full visibility into your SCADA communication links?

Share your protocol mix, approximate node count, and the network segments you want to cover. SDAQ will propose the right capture topology and detector configuration for your site.